CTO Kieran Harty discusses the power of Tintri Analytics with two service provider partners.
Jason Butler (JB) is Head of Solution Development at Nuvias. Nuvias is an award-winning, specialist EMEA distributor of innovative IT solutions, covering technology areas for every part of the business IT infrastructure. Areas Nuvias covers include: data networking, data storage, virtualization, cloud, monitoring & management, and data center infrastructure.
Mark Curry (MC) is Technical Operations Manager at BrightCloud Technologies. BrightCloud provides enterprise-grade managed and cloud-based services focusing on Microsoft, VMware, and Citrix technology. Established in 2000, BrightCloud now supports nearly 50 small and medium-sized businesses and thousands of VMs from its central operations center in the UK and three hosted data centers.
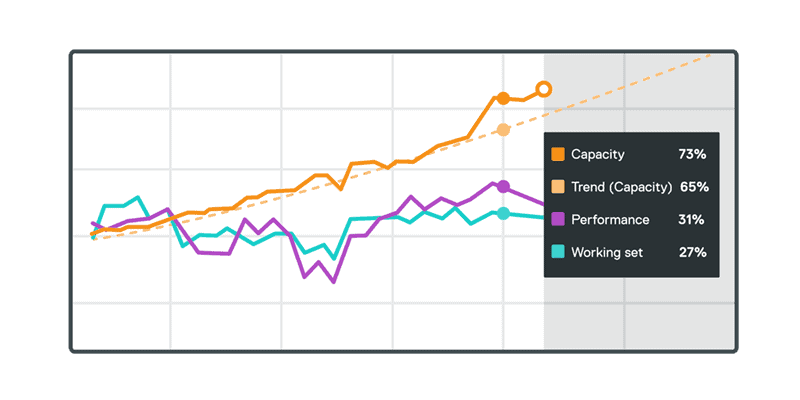
Tintri Analytics helps service providers answer the questions that matter most for their business and their customers. What’s the best way to assess when your storage will need more capacity or performance? How can you see current and historical usage data? How should you plan resources for the future? Tintri Analytics gives you more than information. It uses your application’s performance, capacity, and working set data to predict capacity and performance for storage and compute for future needs.
Recently CTO Kieran Harty (KH) spoke to Jason and Mark who utilize Tintri Analytics both internally and for their customers. Read on to see what they had to say.
- KEY TAKEAWAYS
- Two service providers describe how Tintri Analytics gives you answers you can act on to manage your-and your customers’-storage architecture.
- Tintri’s ability to gather data about individual VMs and containers at a granular level from both compute and storage provides an all-around picture of an application in an instant.
- Tintri Analytics’ detailed metrics ensure you always have the information you need to make the right decisions based on data from your CPU and servers.
KH: Anything else regarding Tintri Analytics that is important for your operations?
MC: It’s one of the quickest applications I’ve used, particularly the speed of UI refreshing. Ask a question, get the answer immediately—no waiting hours for a report. No hourglass. No wheel spinning. Tintri has accelerated the provisioning of existing services. The ability to dive into analytics allows us to highlight top resources for consumers and focus on internal cost management. Legacy tools were too difficult to use for predictive analytics; it was impossible to pinpoint where to start. I’m really pleased we have invested in a vendor that continues to develop the products— not just VMstores but also analytics—and supports the community.
JB: Application detection is quite nice and useful. We can see the top three applications, which means we can see Exchange servers, file and print servers, etc., giving us a breakdown of our working set, our distribution, etc. We use Tintri Analytics in our demo environments, our internal infrastructure, and as a selling point with customers. We rely on Tintri and VMware architecture for multiple customers with manual systems for marketing platforms, support services, and more. It is a great tool for planning future growth.
KH: How does Tintri Analytics solve problems for your company or your customers?
MC: With our previous storage system, it was very painful to try to estimate what we would need to accommodate a change for our customers. Tintri has a much simpler approach to managing storage. Not having to deal with LUNs and volumes is a huge benefit for us. And Tintri removes guesswork. With Tintri Global Center (TGC), we can see real-time information on our IOPS, throughput, and latency and observe how individual VMs are performing. We used to spend at least a half a day per week managing our legacy storage environment.
When we purchased our first VMstores, Tintri Analytics wasn’t available. Once released, we started using it immediately. It’s a great property and Tintri gave it to us for no additional cost. Not many companies do that. Before implementing VMStores, it took customers 30 minutes to complete reports. Now with Tintri, reports complete in two minutes, which equals very happy customers.
JB: Our use of Tintri Analytics is very much about looking at trends. We can see how busy our servers are right from the Tintri UI, which is a big advantage for us. It gives us an overall view that we can share with our decision makers to see how well our systems are being utilized from an internal standpoint. And it also provides great information to show customers.
More and more systems these days have analytics built in. But Tintri has done it really well for a long time. Customers can easily see the stats from a particular array and it’s all coming from our storage system. To get this level of information out of other systems such as VMWare or Hyper-V is a lot harder. And because the analytics are built in to the storage support platform, customers don’t need to install anything to actually have these tools at their fingertips. This power, this information is a massive boon for us and a good selling point for customers.
KH: The latest release of Tintri Analytics added detailed metrics on servers in addition to storage. What benefits has the upgrade had for you?
MC: We’ve now got compute and memory as well as capacity and performance. From the dashboard, you can see how much memory and CPU you’re using across your entire system as a percentage. The UI displays usage against capacity with clear graphics. Though I use analytics primarily for storage performance and capacity, I appreciate that we have the ability to get the same level of statistics for memory usage. We tend to use vRealize suite for this at the moment, but may dive into Tintri’s abilities soon.
JB: We have the latest upgrade running on our main infrastructure and it’s helpful to see how well our systems are being used. Before the upgrade, our boxes were quite busy; the new metrics enabled us to see bottlenecks that were causing problems. Since migrating and finding issues using Tintri Analytics, we’ve been able to level out our infrastructure. Things are running a lot better now, reducing our need to add storage and using our equipment more effectively and efficiently. Our servers too are operating more efficiently because of the rebalancing we did based on what we learned from Tintri Analytics. For example, we moved some workloads into the cloud that didn’t need to be in local storage.
KH: Were there any other data center challenges you faced where Tintri Analytics played a big role? Have you used the “what if” analysis?
MC: At one point last year, I noticed the working set was very high on a VMstore. I was able to dive down a couple of levels to identify what was contributing to that metric and get to the root cause quickly, then sending the name of the VM or VMs to the service desk and customer.
As for “what if” analysis, we are able to group virtual machines by customer. So, if I know there’s a specific project that a customer wants to implement, I can dive into Tintri Analytics, look at the average size of their VMs, and see if they have the capacity and performance the customer needs. From there, we can see what effect adding 10 or 20 or more VMs will have and properly plan for the future.
JB: We did an Oracle CRM migration and plan. We moved some infrastructure off our local storage to Oracle’s cloud, but first used Tintri Analytics to analyze the possibility of keeping everything local. We modeled what we currently had and modeled the extra load we would add using Tintri Analytics and the “what if” capability.
KH: Tell me how Tintri storage fits into your business model.
MC: Tintri is so simple to use. It gives us and our customers the performance we need for our virtual machines (VM). Tintri has enabled a further differentiator for us when it comes to our IaaS (Infrastructure-as-a-Service) offerings. Unlike some service providers, we don’t feel the need to offer tiered storage performance options at multiple price points for our hosted customers. We have the confidence that Tintri will deliver the performance every VM wants and needs with no management overhead. To date, this has worked extremely well and all of our customers get the full benefits of Tintri’s outstanding performance.
It’s also extremely helpful with planning. We dive in at least once a month and are able to see how the entire VMstore is growing but can also narrow it down to specific customers. I particularly appreciate the applications feature where we can group VMs together and see how they behave. I get that information in a few minutes and then we can see how an individual customer’s storage is growing and start planning for additional VMs. That is quite powerful.
We use Tintri Analytics for forecasting and budgeting. We look at how a customer is using VMs from a storage perspective and plan out the next year/year-and-a-half for them to either purchase more storage now or as part of their organic growth going forward. Should the customer look to add another 10 or 20 VMs? When are we likely to have to purchase another VMstore? Tintri analyzes all the existing data—going back three years—and we use that to predict what will be needed in the next 18 months. All of which helps our customers manage infrastructure and save money.
JB: Our use of Tintri is external and internal. We sell Tintri to many of our customers across a range of businesses. But we also use Tintri storage as part of our main infrastructure. Everything sits on Tintri devices including our Oracle CRM and other platforms. Importantly, we use Tintri Analytics as part of our demonstration lab environments. We have a stand-alone environment with a large selection of vendor software and hardware that we run off a fully virtualized platform built around Tintri. The demo system hosts 600 VMs, comprising various vendor platforms that run on Tintri. These are essentially multi-cloud environments that use VMware, Hyper-V, OpenStack, and more.
The Tintri platform is an extremely powerful tool that enables us to do API integration and automation while Tintri Analytics lets us see how the whole system is running. We can see our internal infrastructure, demo platforms, and customer systems, all from a single pane of glass.
