- KEY TAKEAWAYS
- Tintri Analytics doesn’t just give you information. It gives you answers, and the ability to act on them to manage your storage footprint.
- Working at the application level, Tintri Analytics offers insight into the exact behaviors and needs of individual applications.
- Built on Apache Spark and Elasticsearch, Tintri Analytics crunches up to 3 years of data (hundreds of thousands of VMs) in less than one second.
We’ve made it simple: Go into Plans, choose an application you’d like to deploy (in this case, VDI) and select the number of instances (in this case, 25). Plus, if you want to model the impact on a subset of your footprint, you just assign target VMstores in a dropdown. Tintri Analytics shows you the results of your deployment immediately and in real-time.
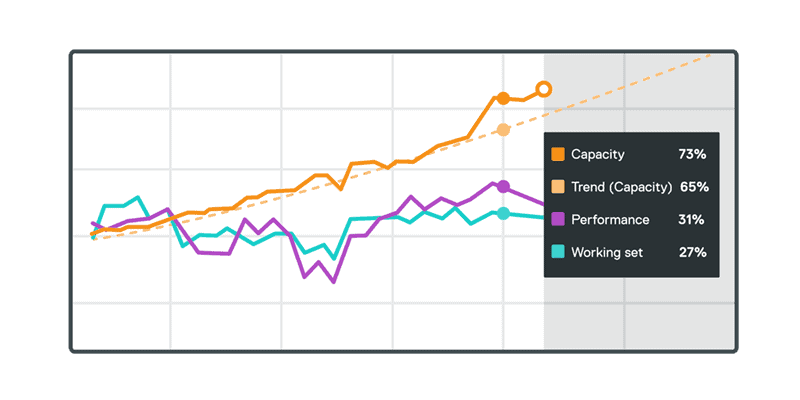
Since the results are pretty dreary in this scenario, overloading capacity and performance (and almost working set), you can fine-tune the results by provisioning fewer new instances or adding more VMstores to your candidate targets. Tintri provides not just transparency for your storage, but the ability to take action on it.
What metrics does Tintri Analytics report?
Tintri reports three primary metrics:
- Logical capacity (size of VMs post-thin provisioning, pre-compression/deduplication)
- IO performance (the IO/throughput resources a VM needs)
- Working set (how much flash you need to store hot data, after applying our data reduction algorithms).
You don’t have to try and interpret these results, because each metric already synthesizes multiple factors. IO performance, for instance, considers such criteria as IO size, read/write mix and throughput to make sure you can immediately understand your VMstore’s performance.
Unprecedented granularity
“Plans” is just one of the views. Using the top navigation bar, you can easily switch to other Tintri Analytics views:
- Trends: Helps you determine where your capacity and performance changes are occurring. Sometimes, it’s hard to see whether you’re adding more VMs, or if your VMs are just getting bigger. Insights show you how your applications’ resource needs change over time, giving you control over your footprint.
- Plans: As you’ve seen already, lets you plan your resources, modeling whether your footprint can support new workloads with what-if analysis. We know that with deduplication and compression, it’s not just a capacity game anymore, so we consider performance and working set as well.
- Applications: Establishes the applications used in your environment. You define application types, for example, grouping together all virtual desktops or all SQL Servers. Now, for each application type, you can see the average resources used by member VMs, or identify outliers that need your attention.
Get started
Tintri Analytics is unlike any other storage analytics tool on the market, and it advances Tintri’s foundation of VM-aware storage. Revolving around Tintri’s broader scale-out architecture, Tintri Analytics puts the steering wheel back in your hands, helping you optimize your virtual footprints for both cost and performance.
To learn more, check out our Tintri Analytics white paper, which drills into each view and describes our analytics methodology. Take your time, and dive deep. Tintri Analytics does.
Today, we launched a modern approach to storage scale-out—including new predictive analytics. Plenty of other storage providers have been making a fuss about their analytics. As is typical of Tintri, we’re taking a different approach. While their focus has been on presenting information, we’ve built predictive analytics that help you answer the questions that matter in your data center.
How do you plan resources for more instances of an application? How do you figure out when your storage will run out of capacity or performance? How can you see the historical usage data of your applications?
Is your storage analytics providing information or answers? Enter Tintri Analytics.
What makes Tintri Analytics different?
Three main things:
- Application-level. Other storage platforms are built on LUNs and volumes, and so any analytics they offer are stuck at the LUN or volume level. It’s little help to know the average performance of tens or hundreds of applications in a LUN—you need to know the exact behaviors and needs of individual applications. This is only possible with Tintri’s VM-aware storage (VAS) foundation, and with Tintri Analytics. Anyone claiming application-level analytics in a LUN-based environment is using clunky correlations and assumptions rather than actual application data.
- Resource planning. Storage is complicated, and yet for some reason, conventional storage analytics tools and application-level planning tools don’t correlate storage information with application information. Tintri Analytics shows you what your virtualized applications actually need, letting you plan from the application down, rather than the infrastructure up.
- Ad hoc analytics. Unlike the clunky columnar databases of conventional analytics tools (where you’re extremely limited in what you can analyze), Tintri Analytics is built on Apache Spark and Elasticsearch. A powerful real-time analytics engine, Elasticsearch lets you drill down into your data quickly—crunching up to 3 years of data (about hundreds of thousands of VMs) in less than one second. Now you can perform what-if analysis in planning for applications, and/or precisely forecast requirements for capacity and performance six months into the future.
But the most important thing is this: where conventional storage gives you information to peruse, Tintri Analytics gives you answers that motivate action.


